The Law of Demand Explained Simply (With Diagram & Examples)
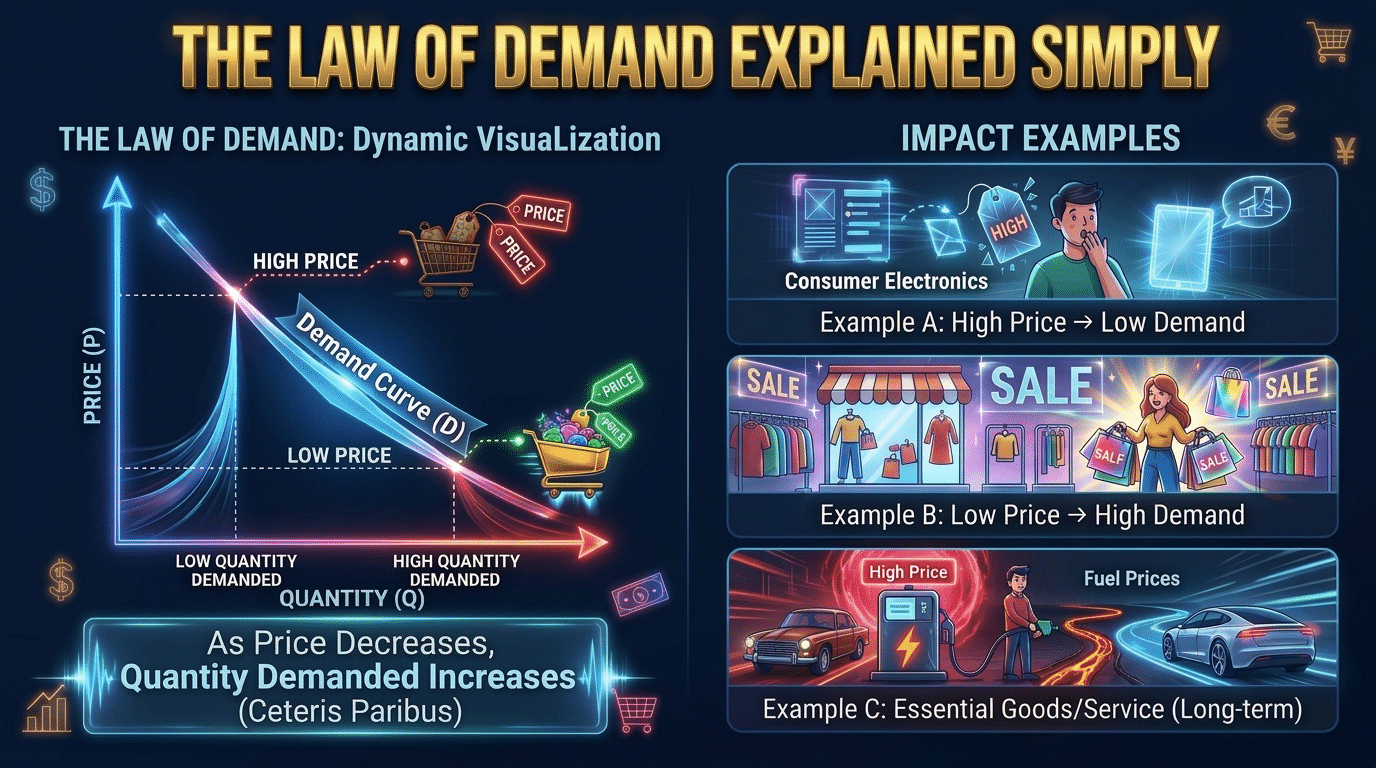
We notice in our practical life that when something is cheap in the market, we buy more; on the other hand, if a good or service is expensive, we buy less. Simply, this human behavior is called the law of demand in economics.
The law of demand explained simply, is that you might buy more if there is 40 % off on a dress sale, while you purchase less if the price of fruit has gone up compared to a day ago.
Introduction
Before discussing the Law of Demand, it is imperative to clarify the definition and concept of what is meant by ‘Demand’. Demand means that a person is willing or wants to buy a good or service and can also buy (have the capacity to buy) that good or service; then we can say it is demand.
In the law of demand explained simply, if a person wants to buy a specific good or service but he/she has no money to buy it, then it cannot be said to be demand. On contrary to this if a person has money but he or she does not want to buy that specific good or service, then it will not be a demand.
So, for demand, both conditions are necessary: first, want or willingness, and second, the capacity or money to buy it; otherwise, it is not demand.
For example, if Jamal wants to buy a car, its price is 25 lakh rupees. We will say it to demand of car, if Jamal has 25 lakh rupees to buy a car. On the other hand, if Jamal has 25 lakh rupees but doesn’t want to buy that car, then we cannot say there is demand for that car.
What is the Law of Demand?
The law of demand explained simply, is a very important law in microeconomics. Different economists have explained it differently with their own wording, but here I am presenting the definition of Alfred Marshel, which is as follows:
”Other things remaining the same, when the price of any commodity rises, its demand contracts, while a fall in the price of any commodity results in the expansion of its demand”.
According to this law, quantity demanded depends upon price. There is a negative relationship between demand and price. This demand function can be written as follows:
Qd = f (P)
Where Qd stands for quantity demanded, while P stands for price. The complete demand function in general form is given as
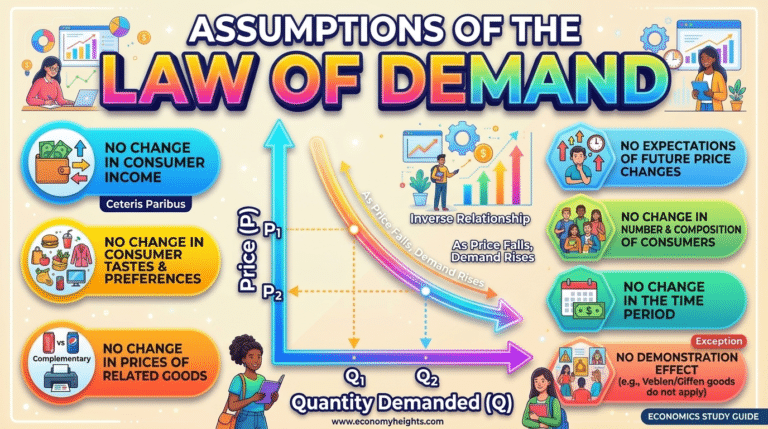
Qd = f (P, Ps, Y, T, E, Nc)
Where:
Qd = Quantity Demanded
P = Price
Ps = Price of related goods or substitute goods/ services
Y = Income
T = Tastes and preferences of consumers
E = Expectations of the consumers
Nc = Number of consumers
In fact, Y, T, E, Nc, are assumptions of the law of demand. The law of demand is related to consumers, as we are all people, more than 8.30 billion on this planet of Earth; all are consumers.
Demand Schedule for Apples (The Data Table)
| Price (P) of Apples in Rupees | Quantity Demanded (Qd) of Apples in Kg | Points |
| 30 | 1 | A |
| 20 | 2 | B |
| 10 | 3 | C |
Demand Schedule
In our topic, the law of demand explained simply; the above-mentioned table shows the prices of apples in rupees in the first column and the quantity of apples in kilograms in the second column, while the third column highlights different points like A, B, and C, where price and quantity demanded intersect to each other.
The Demand Curve (The Visual Graph)
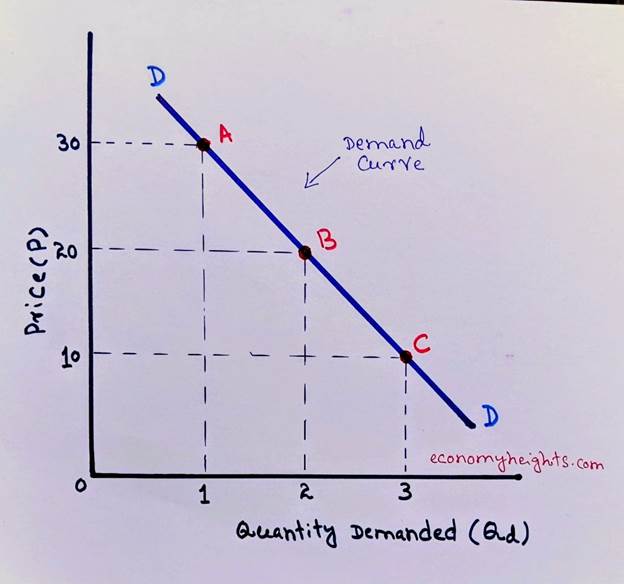
The above-mentioned diagram shows the demand curve DD, which is according to the law of demand explained simply. Here, quantity demanded (Qd) has been taken on the X-axis, while price (P) is on the Y-axis. We have taken quantity demanded (Qd) of apples in kilograms; on the other hand, price (P) is in rupees.
Explanation of the Demand Curve Graph
On the X-axis, increases and decreases in quantity demanded (Qd) happen, while on the Y-axis, increases and decreases in price, or rises and falls in price, take place.
In the diagram, when the price of apples is Rs.30, the consumer is purchasing 1 kg of apples, so in the diagram both dotted lines intersect at point A; it means the consumer is at point A.
The next day (next tenure), when the consumer goes to the market, he comes to know that the price of apples has gone down from Rs.30 to Rs.20, due to which the consumer will buy more apples, 2 kg instead of 1 kg, because the price of apples has fallen. As we have studied in the definition of the law of demand, when the price falls, demand expands (expansion).
But keep in mind, here on X-axis quantity demanded (Qd) will increases, the expansion in demand will happen somewhere else, that we will be discussed later on, in our topic of the law of demand explained simply. Here we get point B, at the intersection of two dotted lines, when the price is Rs. 20, and quantity demanded (Qd) is 2 kg.
Now in third day, price falls to Rs.10 from Rs.20, so due to which consumer will buy 3 kg apples, instead of 2 kg. It means expansion in demand has taken place. On the X-axis, quantity demanded (Qd) has increased from 2 kg to 3 kg. At the intersection of the two dotted lines, we get a third new point C; now the consumer is at this point C.
In our above explanation, I discussed one part of the definition of the law of demand, means when prices falls/decreases, due to which demand expands (expansion in demand) or an increase in quantity demanded (Qd) takes place, in our debate about the law of demand explained simply.
The second part of the law of demand can be understood very easily, infact that is reverse of the first part. It means that when prices increase, demand contracts (contraction), or quantity demanded (Qd) decreases.
The law of demand explained simply says that, in the diagram, when prices increase/rise from Rs.10 to Rs.20, and then to Rs.30, it will impact the quantity demanded (Qd) to decrease from 3 kg to 2 kg, and then to 1 kg. Means, demand contracts or contraction in demand happens.
Now I will shed light on the third part of the definition of the law of demand, which is, in fact, at the start of the definition, ‘other things remaining the same’ or Ceteris Paribus; these are assumptions of this law. It reflects that this law will only be true/valid if few things/factors are kept constant, such as consumer income, taste, price of substitute goods, expectations, number of consumers, etc. These are those elements like P, Ps, Y, T, E, Nc, which we have discussed in the main equation of the law of demand, Qd = f (P, Ps, Y, T, E, Nc), immediately after the definition of the law, in our law of demand explained simply.
Expansion and Contraction of Demand
Expansion means when demand increases due to a decrease or fall in price, while contraction happens when demand decreases due to an increase or rise in prices. In diagram, expansion means when consumer move from point A to point B, and then C on the demand curve, on contrary to this in case of contraction consumer move from point C to point B, and to A.
Expansion and contraction are also called movement along the same demand curve. In our debate of the law of demand explained simply, it is important to highlight that
This demand curve is also called the Marshallian demand curve, by the name of Alfred Marshall, who presented the definition of the law of demand.
Real-World Examples about Law of Demand
The law of demand explained simply, elaborates that it isn’t merely an academic law present in textbooks. It is practically applicable in every place in our lives. It is a prominent principle that guides us when we do shopping of goods and services around us.
A. Black Friday and Cyber Monday Shopping Spree
Shopkeepers reduce prices of television sets, refrigerators, clothing, and video games by 50% to 70% to attract more customers and increase their sales. This situation is aligned with the law of demand.
B. Airline Ticket Pricing and Off-Peak Travel
Airlines utilize advanced software to shift their ticket pricing based on buyer habits. If you try to book a flight to a popular vacation destination during the peak of summer, prices are exceptionally high, which keeps casual, budget-conscious travelers at home. However, during the rainy off-peak season, airlines drop their ticket prices significantly to fill empty seats. The cheaper prices successfully convince people to buy tickets for trips they otherwise wouldn’t take.
C. Fast Food “Value Menus” and Combo Deals
Consider your favorite local fast-food chain. If a standalone premium burger costs $8.00, you might buy just one. However, if the restaurant introduces a promotional “Value Menu” where smaller burgers or side dishes are priced at just $2.00 each, customers naturally end up buying three or four items at a single time because the entry price is so low.
D. Digital App Subscriptions and Streaming Launches
When a new video streaming platform enters a crowded market, it typically launches with a highly discounted introductory price (e.g., $4.99 a month) to attract a massive user base. Because the barrier to entry is minimal, millions of households sign up instantly. If the platform later increases its monthly fee to $15.99, a visible percentage of subscribers will cancel their memberships, shifting back down the demand curve.
Q- What is the Law of Demand in simple form?
The Law of Demand states that when the price of a good falls, consumers buy more of it. On the other hand, when the price rises, consumers purchase less of that good, assuming other things remain the same.